
ගොනුව:Price elasticity of demand and revenue.svg

Size of this PNG preview of this SVG file: 215 × 320 පික්සල. අනෙකුත් විභේදනයන්: 161 × 240 පික්සල | 322 × 480 පික්සල | 516 × 768 පික්සල | 688 × 1,024 පික්සල | 1,376 × 2,048 පික්සල.
මුල් ගොනුව (SVG ගොනුව, නාමමාත්රිකව 215 × 320 පික්සල්, ගොනු විශාලත්වය: 9 කි.බ.)
| විස්තරය |
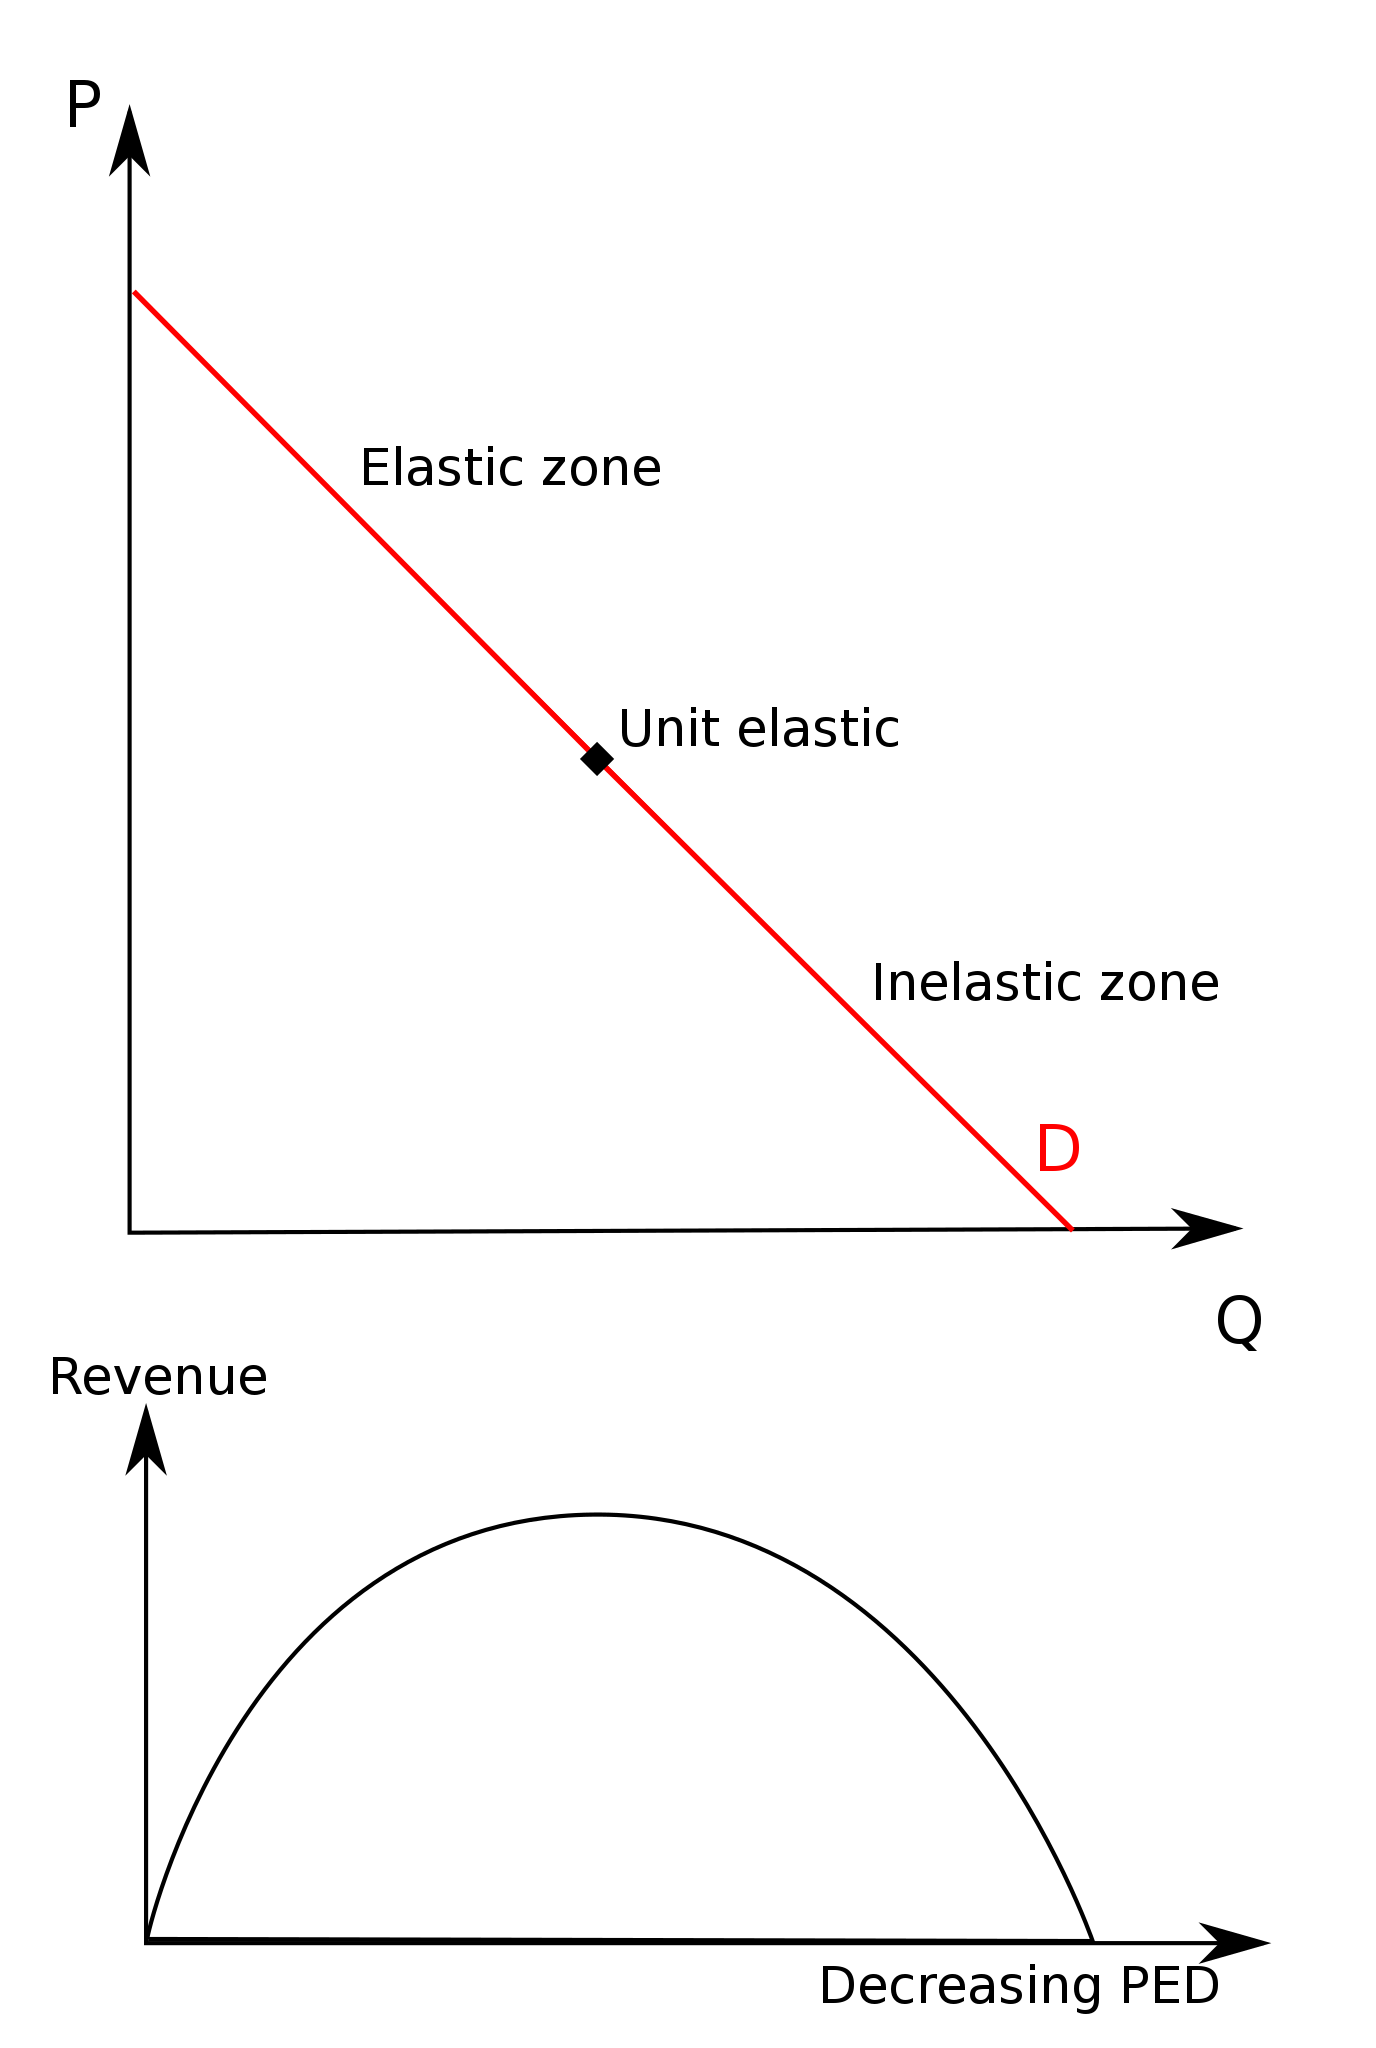
English: An SVG-ified graph showing the relationship between elasticity and revenue. Such graphs are common when explaining this relationship; for an interactive Java applet demonstrating the concept, see [1]. A chart showing total revenue (but not an associated demand curve) is also available in Pashigian, Peter B. (1998). Price Theory and Applications. McGraw-Hill. ISBN 0070487782. Note: not as strictly accurate as original file. |
| දිනය | (UTC) |
| මූලාශ්රය | |
| කර්තෘ |
|
I, මෙම කාර්යයේ ප්රකාශන අයිතිය දරන්නා,පහත බලපත්රය යටතේ එය ප්රකාශයට පත් කරනු ලබයි:
| මෙම ගොනුව ක්රියේටිව් කොමන්ස් Attribution-Share Alike 3.0 Unported වරපත යටතේ අවසර ලබා ඇත. Subject to disclaimers. | ||
| ||
| GFDL බලපත්ර යාවත්කාල කෙරුමහි කොටසක් ලෙස මෙම ගොනුවට බලපත්ර ටැගය එක් කෙරිනි. |

|
Free Software Foundation විසින් ප්රකාශිත GNU Free Documentation License බලපත්රයෙහි 1.2 හෝ ඊට අලුත් පිටපත්වල කොන්දේසිවලට යටත්ව මෙම ගොනුව පිටපත් කෙරුමට, නැවත බෙදාහාරුමට සහ/හෝ වෙනස් කෙරුමට අවසර දී ඇත; ඒ වෙනස් අංශ නොමැතිව, මුල් පිටු පෙළ නොමැතිව, පසු පිටු පෙළ නොමැතිවය. බලපත්රයේ පිටපතක් GNU Free Documentation License නම් අංශයේ දැක්වේ. Subject to disclaimers. |
ඔබට අභිමත වරපත තෝරාගත හැක.
ප්රකෘති පැටවුම් ලොගය
This image is a derivative work of the following images:
- File:Price_elasticity_of_demand_and_revenue.png licensed with Cc-by-sa-3.0-migrated, Cc-by-sa-3.0-migrated-with-disclaimers, GFDL, GFDL-en
- 2010-02-28T15:06:27Z File Upload Bot (Magnus Manske) 430x505 (7871 Bytes) {{BotMoveToCommons|en.wikipedia|year={{subst:CURRENTYEAR}}|month={{subst:CURRENTMONTHNAME}}|day={{subst:CURRENTDAY}}}} {{Information |Description={{en|A graph showing the relationship between elasticity and revenue. Made by
Uploaded with derivativeFX
ගොනු ඉතිහාසය
එම අවස්ථාවෙහිදී ගොනුව පැවැති ආකාරය නැරඹීමට දිනය/වේලාව මත ක්ලික් කරන්න.
| දිනය/වේලාව | කුඩා-රූපය | මාන | පරිශීලක | පරිකථනය | |
|---|---|---|---|---|---|
| වත්මන් | 15:22, 28 පෙබරවාරි 2010 | | 215 × 320 (9 කි.බ.) | Jarry1250 | Sorry, uploaded wrong version. This one has the correct labels. |
| 15:14, 28 පෙබරවාරි 2010 |  | 215 × 320 (7 කි.බ.) | Jarry1250 | {{Information |Description={{en|An SVG-ified graph showing the relationship between elasticity and revenue. Such graphs are common when explaining this relationship; for an interactive Java applet demonstrating the concept, see [http://www.econtools.com/j |
ගොනු භාවිතය
පහත දැක්වෙන පිටුව විසින් මෙම ගොනුව භාවිතා කෙරෙයි:
ගෝලීය ගොනු භාවිතය
පහත දැක්වෙන අනෙකුත් විකියන් මගින් මෙම ගොනුව භාවිතා කරයි:
- de.wikipedia.org හි භාවිතය
- en.wikipedia.org හි භාවිතය
- es.wikipedia.org හි භාවිතය
- ja.wikipedia.org හි භාවිතය
- pt.wikibooks.org හි භාවිතය
- pt.wikiversity.org හි භාවිතය
- uk.wikipedia.org හි භාවිතය
- uz.wikipedia.org හි භාවිතය