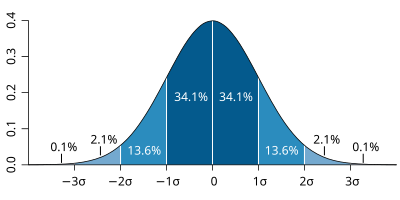
ගොනුව:Standard deviation diagram.svg

Size of this PNG preview of this SVG file: 400 × 200 පික්සල. අනෙකුත් විභේදනයන්: 320 × 160 පික්සල | 640 × 320 පික්සල | 1,024 × 512 පික්සල | 1,280 × 640 පික්සල | 2,560 × 1,280 පික්සල.
මුල් ගොනුව (SVG ගොනුව, නාමමාත්රිකව 400 × 200 පික්සල්, ගොනු විශාලත්වය: 17 කි.බ.)
ගොනු ඉතිහාසය
එම අවස්ථාවෙහිදී ගොනුව පැවැති ආකාරය නැරඹීමට දිනය/වේලාව මත ක්ලික් කරන්න.
| දිනය/වේලාව | කුඩා-රූපය | මාන | පරිශීලක | පරිකථනය | |
|---|---|---|---|---|---|
| වත්මන් | 02:06, 15 ජනවාරි 2015 |  | 400 × 200 (17 කි.බ.) | GliderMaven | Average is now zero not mu |
| 11:08, 7 අප්රේල් 2007 |  | 400 × 200 (14 කි.බ.) | Petter Strandmark | == Summary == Standard deviation diagram, based an original graph by Jeremy Kemp, in 2005-02-09 [http://pbeirne.com/Programming/gaussian.ps]. This figure was started in R using: <pre> x <- seq(-4,4,.1) plot(x,dnorm(x),type |
ගොනු භාවිතය
පහත දැක්වෙන පිටුව විසින් මෙම ගොනුව භාවිතා කෙරෙයි:
ගෝලීය ගොනු භාවිතය
පහත දැක්වෙන අනෙකුත් විකියන් මගින් මෙම ගොනුව භාවිතා කරයි:
- af.wikipedia.org හි භාවිතය
- ar.wikipedia.org හි භාවිතය
- ast.wikipedia.org හි භාවිතය
- as.wikipedia.org හි භාවිතය
- ba.wikipedia.org හි භාවිතය
- be-tarask.wikipedia.org හි භාවිතය
- bg.wikipedia.org හි භාවිතය
- bn.wikipedia.org හි භාවිතය
- bs.wikipedia.org හි භාවිතය
- ca.wikipedia.org හි භාවිතය
- cbk-zam.wikipedia.org හි භාවිතය
- cs.wikipedia.org හි භාවිතය
- cv.wikipedia.org හි භාවිතය
- cy.wikipedia.org හි භාවිතය
- dag.wikipedia.org හි භාවිතය
- da.wikipedia.org හි භාවිතය
- de.wikipedia.org හි භාවිතය
- de.wikiversity.org හි භාවිතය
- el.wikipedia.org හි භාවිතය
- en.wikipedia.org හි භාවිතය
මෙම ගොනුවේ තවත් ගෝලීය භාවිත බලන්න.

