ගොනුව:Global Temperature Anomaly 1880-2010 (Fig.A).gif

Page contents not supported in other languages.
විකිපීඩියා වෙතින්

Global_Temperature_Anomaly_1880-2010_(Fig.A).gif(658 × 474 පික්සල, ගොනු විශාලත්වය: 30 කි.බ., MIME ශෛලිය: image/gif)

මෙම ගොනුව Wikimedia Commons වෙතින් වන අතර අනෙකුත් ව්‍යාපෘතීන් විසින්ද භාවිතා කල හැක. එහි ගොනු විස්තර පිටුව තුල අඩංගු විස්තර මෙහි පහත දැක්වෙයි.

සාරාංශය

විස්තරය
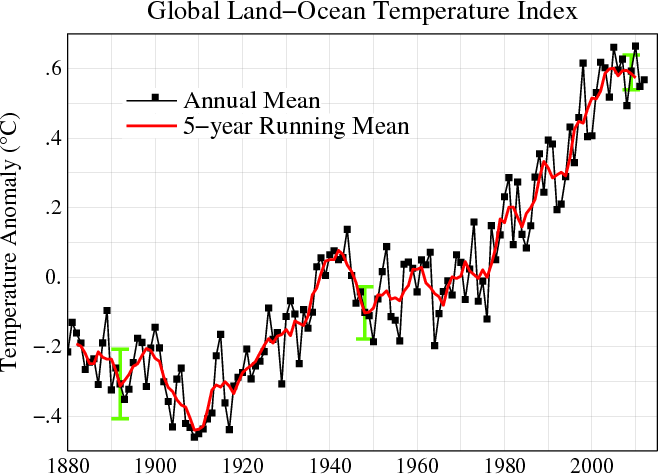
English: Line plot of global mean land-ocean temperature index, 1880 to present, with the base period 1951-1980. The black line is the annual mean and the red line is the five-year running mean. The green bars show uncertainty estimates. [This is an update of Fig. 1A in Hansen et al. (2006).] The graph shows an overall long-term warming trend.
දිනය
මූලාශ්‍රය http://data.giss.nasa.gov/gistemp/
කර්තෘ NASA Goddard Institute for Space Studies
අවසරය
(මෙම ගොනුව නැවත භාවිතා කරමින්)
Public domain This file is in the public domain in the United States because it was solely created by NASA. NASA copyright policy states that "NASA material is not protected by copyright unless noted". (See Template:PD-USGov, NASA copyright policy page or JPL Image Use Policy.)
Warnings:
අනෙකුත් අනුවාදයන්

PDF version: File:Global_Temperature_Anomaly_1880-2010_(Fig.A).pdf. SVG version (1880-2010 data, 1961-1990 base period): File:Instrumental Temperature Record (NASA).svg

File:Global Temperature Anomaly.svg is a vector version of this file. It should be used in place of this GIF file when not inferior.

File:Global Temperature Anomaly 1880-2010 (Fig.A).gif → File:Global Temperature Anomaly.svg

For more information, see Help:SVG.

In other languages
Alemannisch  Bahasa Indonesia  Bahasa Melayu  British English  català  čeština  dansk  Deutsch  eesti  English  español  Esperanto  euskara  français  Frysk  galego  hrvatski  Ido  italiano  lietuvių  magyar  Nederlands  norsk bokmål  norsk nynorsk  occitan  Plattdüütsch  polski  português  português do Brasil  română  Scots  sicilianu  slovenčina  slovenščina  suomi  svenska  Tiếng Việt  Türkçe  vèneto  Ελληνικά  беларуская (тарашкевіца)  български  македонски  нохчийн  русский  српски / srpski  татарча/tatarça  українська  ქართული  հայերեն  বাংলা  தமிழ்  മലയാളം  ไทย  한국어  日本語  简体中文  繁體中文  עברית  العربية  فارسی  +/−
New SVG image

Captions

මෙම ගොනුව නිරූපණය කරන්නෙඑ කුමක්දැයි තනි පේළියේ පැහැදිළි කිරීමක් එක් කරන්න.

Items portrayed in this file

depicts ඉංග්‍රීසි

inception ඉංග්‍රීසි

10 පෙබරවාරි 2011

ගොනු ඉතිහාසය

එම අවස්ථාවෙහිදී ගොනුව පැවැති ආකාරය නැරඹීමට දිනය/වේලාව මත ක්ලික් කරන්න.

දිනය/වේලාවකුඩා-රූපයමානපරිශීලකපරිකථනය
වත්මන්15:56, 21 ජූනි 2013 15:56, 21 ජූනි 2013වන විට අනුවාදය සඳහා කුඩා-රූපය658 × 474 (30 කි.බ.)NigeljUpload version that has been updated with 2012 data
21:20, 19 ජනවාරි 2012 21:20, 19 ජනවාරි 2012වන විට අනුවාදය සඳහා කුඩා-රූපය652 × 474 (31 කි.බ.)Simplex1swrhsI have uploaded a new version of the NASA global temperature graph with 2011 data.
15:58, 19 මාර්තු 2011 15:58, 19 මාර්තු 2011වන විට අනුවාදය සඳහා කුඩා-රූපය652 × 474 (31 කි.බ.)Simplex1swrhsSwitched back to the NASA GISS "Global Land-Ocean Temperature Index" graph with 2010 data update. {{Information |Description= Line plot of global mean land-ocean temperature index, 1880 to present, with the base period 1951-1980. The dotted black line is
20:05, 3 මාර්තු 2011 20:05, 3 මාර්තු 2011වන විට අනුවාදය සඳහා කුඩා-රූපය655 × 439 (30 කි.බ.)OKIsItJustMe{{Information |Description ={{en|1=Line plot of global mean land-ocean temperature index, 1880 to present, with the base period 1951-1980. The dotted black line is the annual mean and the solid red line is the five-year mean. The green bars show uncert

මෙම ගොනුව භාවිතා කරන නිසිදු පිටුවක් නොමැත.

ගෝලීය ගොනු භාවිතය

පහත දැක්වෙන අනෙකුත් විකියන් මගින් මෙම ගොනුව භාවිතා කරයි:

පාරදත්ත

"https://si.wikipedia.org/wiki/ගොනුව:Global_Temperature_Anomaly_1880-2010_(Fig.A).gif" වෙතින් සම්ප්‍රවේශනය කෙරිණි